1420 Northbrook Dr. Suite 220 Gardendale, AL 35071

Dashboard University

Connected Skills Training for MS Office and Power BI

Learn More. Be More.

Teksouth’s Dashboard University (DBU) provides all DoD FM the skills they need to get more done.

  • Technical training classes designed for financial specialists
  • Unleash the power of the software you already have
  • Learn how to automate processes – stop hand-jamming data
  • Training qualifies for CET credit hours for FM Certification

Dashboard University Curriculum

Each of our DBU course qualifies for credit earned toward Level 1, Level 2, and Level 3 FM Certifications. Any four DBU courses may be used to earn Continuing Education and Training (CET) credit hours (Levels 1, 2, and 3) or for Leadership credit hours (Level 1 only). Each student that completes a course will receive a certificate for registering FM DoD certification credit.

Course Title / NumberMS Office Applications 101 (MS-101)
GoalUpon completion of the course, you will understand linking data sets to and from MS Access, tables, append/delete/select queries, basic pivot tables, and basic dashboarding techniques in PowerPoint.
Description

MS-101 guides students through multiple scenarios for creating solutions that leverage the full Microsoft Office Suite.

Course Outline:

  1. Access
    1. Learn how to link data sources from MS Access, MS Excel, text files, csv files, etc.
    2.  Learn how to write simple select, append, delete, and union queries
    3.  Learn how to apply public function VBA
  2.  Excel Formulas
    1. SUMIFS
    2. COUNTIFS
    3. Sticky fields (absolute vs. relative references)
  3.  Excel Charts
    1. Link MS Access tables to Excel
    2. Use formulas to automatically generate charts
    3. Generate charts automatically
  4. MS Excel Pivot Tables
    1.  Create pivot tables
    2. Link tables from Access to Excel pivot table
    3. Using pivot table
      1.  Pivot table calculated fields
      2.  Basic analysis
  5.   Introduction to PowerPoint
    1.  Link Excel charts and graphs to PowerPoint
    2. Create action buttons for customized dashboard creations
    3.  Link PowerPoint buttons to other files
Length5 days (includes 2 instructors)
PrerequisitesBasic familiarity with MS Office applications (Access, Excel, Word)
Class SizeNumber of Students: 10-20
Training LocationsClasses are at customer site
Class SchedulesCall (205) 631-1500 for current schedules
Special NotesActual travel cost(s) per the JFTR/JTR
Course Title / NumberMS Office Applications 201 (MS-201)
GoalUpon completion of the course, you will understand linking data sets to and from MS Access, creating tables, join functions, VBA, append/delete/select queries, join tables/queries, intermediate pivot table functions, and intermediate dashboarding techniques.
Description

Building on skills gained in MS-101, this course guides students through multiple scenarios for creating more complex solutions that leverage the full Microsoft Office Suite. Course Outline:

  1.   Access
    1. Review how to link data from Access, Excel, text files, csv files, etc.
    2. Review how to write simple select, append, delete, and union queries
    3. Learn how to stack multiple data sources
    4. Learn how to join two queries
    5. Learn how to apply public function VBA
  2.   Excel Formulas
    1. Review SUMIFS and COUNTIFS
    2. Set up automated graphs and charts with SUMIFS, sticky fields (absolute vs. relative references), and macros
    3. Automated updates (daily, monthly, and yearly)
  3.   Excel Charts
    1. Review linking Access tables to Excel
    2. Review using formulas to automatically generate charts
    3. Use macros to automatically update charts and Excel data
    4. Chart multiple data sources together
    5. Advanced conditional formatting
  4. MS Excel Pivot Tables
    1. Review creating pivot tables and linking tables
    2. Review pivot table functionality and calculated fields
    3. Calculated items
    4. Use slicers
    5. Pivot table intermediate analysis
    6. Write macros for automated updates
  5. 5)  Intermediate PowerPoint
    1. Review linking Excel charts and graphs to PowerPoint
    2. Review creating action buttons for customized dashboard creations
    3. Review linking PowerPoint buttons to other files
    4. Basic dashboard setup and design
Length5 days (includes 2 instructors)
PrerequisitesMS-101, or experience creating basic Access databases, linking data between Access and Excel, and displaying data from Excel using PowerPoint
Class SizeNumber of Students: 10-20
Training LocationsClasses are at customer site

In Dashboard University 301 the students will need an advanced background of Microsoft Office applications or been through MS Office Applications 101 and 201.

Course Outline:

  • Mail Merge Usage
  • Excel formulas (Day 4 Advanced AM)
  • MS Excel Pivot Tables
  • Advanced Power Point
Course Title / NumberDashboard University 301 for Advanced Users (DASH-301)
GoalStudents will learn how to create fully functioning/automated dashboards and analytical tools. They will learn advanced forms of VBA and functions in MS Office (Excel, Access, PowerPoint, Word, and Outlook) that will automate data retrieval and reporting for the data sources their financial, logistics, medical, training, personnel, and manpower data sets.
Description
  1. MS Access Advanced Design
    1. IIF Formulas
    2. String formulas
    3. Left, right, mid formulas
    4. Date diff formula
    5. Primary key
    6. Indexing tables
    7. Join multiple tables
    8. Create table from query
    9. Update tables with append/delete queries
    10. Change format of records
    11. Stack data
    12. Update linked Excel files using VBA
  2. Mail Merge Usage
    1. Link Access to MS Word
    2. Verify and/or adjust filters on mail merge document
    3. Send mass emails using Word 3)  Excel formulas (Day 4 Advanced AM)
  3. Link Access to Excel
    1. SUMIFS and COUNTIFS
    2. Graphing with SUMIFS and sticky fields
    3. Dashboard setup form
  4. Excel Pivot Tables
    1. Review creating pivot tables
    2. Review linking tables from Access to Excel pivot table
    3. Review pivot table functionality
    4. Write macros for automated updates
  5. Advanced PowerPoint
    1. Review linking Excel charts and graphs to PowerPoint
    2. Review creating action buttons for customized dashboard creations
    3. Review linking PowerPoint buttons to other files
    4. Advanced dashboard setup and design (print macro, PDF print macro)
Length5 days (includes 2 instructors)
PrerequisitesAdvanced background of MS Office applications, or completion of MS-101 and MS-201
Class SizeNumber of Students: 10-20
Training LocationsClasses are at customer site
Class SchedulesCall (205) 631-1500 for current schedules
Course Title / NumberDashboard University 401 for Leaders (DASH-401)
GoalThis course is designed to help both leaders and analysts design the most optimal decision support tool available.
Description

Course Outline

  1. Power of Microsoft Windows
    1. Making Windows more useful (automating complex/routine tasks)
    2. Tools
      1. Set up display and jump lists
      2. Problem steps recorder
      3. Search
      4. Adjust taskbar buttons
      5. Add key applications above the line
      6. Quick save as
      7. Jump lists
      8. Adding folders to favorites
      9. Libraries
      10. Scroll all open windows
      11. Snipping tool
  2. How MS Office Applications Work in Desktop Tools
    1. Access data engine
    2. Excel ad hoc query ability
    3. PowerPoint dashboard
    4. Word and Outlook: Automating notifications
  3. Excel Power Pivot
    1. Providing the ability to answer leadership questions
    2. Ad hoc queries
    3. “What if?” analysis
    4. Charting and graphic displays
  4. Building and Using PowerPoint Dashboards
    1. Linking charts and data from Excel
    2. Updating data in the dashboard
    3. Adding/deleting slides
Length½ day (includes 1 instructor)
Class SizeNumber of Students: 5-8
Training LocationsClasses are at customer site
Class SchedulesCall (205) 631-1500 for current schedules
  • Basic Excel
  • Create a PivotTable 
  • Edit a PivotTable 
  • Configure and design pivot tables 
  • PivotTable Options
  • Percent of Column/Row/Total 
  • Conditional Formatting
  • Calculated Fields
  • Basic Charts

Course Outline: 

  • Software as a service
  • Excel
  • Teams
  • Outlook
  • OneDrive
  • Forms
  • Lists
  • Planner
  • Power Automate (Power Flow)
  • PowerPoint

Course Outline:

  • How to add people to a chat
  • How to create a Team
  • How to add a Channel to a Team
  • Working with Teams and Channels
    • How to add a tab to a Channel
    • How to create an issue tracker tab
    • How to create a survey tab
    • How to create a SharePoint List tab
  • Working with Files in Teams
    • How to create an Excel tab
    • How to create an Excel file in a Channel
    • How to create a Word document in a Channel
    • How to upload files to Channels
    • Collaborating with files in Channels
  • Working with Meetings
    • How to create breakout rooms
    • How to add people to a meeting
    • How to share content in Meetings
    • How to modify Meeting Options
    • How to record a meeting
    • How to use Whiteboard
  • Working with Apps
    • How to add an App to a Team
    • Power Apps

The Power BI class will focus on overall Power BI functions, capabilities, and best practices. This class is tailored to Financial Managers who have a high level of expertise managing information and reports – particularly using Microsoft Excel.

Course Outline:

Day 1

  • a. Introduction to Power BI
  • b. Foundational Understanding
  • c. Demonstrations
  • d. Q&A

Day 2

  • a. Working with Data
  • b. Working with Visualizations
  • c. Lab/Hands on training
  • d. Q&A

Day 3

  • a. Working with Data
  • b. Working with Visualizations
  • c. Lab/Hands on training
  • d. Q&A

Day 4

  • a. Working with Data
  • b. Working with Visualizations
  • c. Lab/Hands on training
  • d. Q&A
  • Create a PivotTable 
  • Edit a PivotTable 
  • Configure and design pivot tables 
  • PivotTable Options 
  • Advanced Filtering 
  • Drill Down 
  • Slicers 
  • Percent of Column/Row/Total 
  • Conditional Formatting
  • Calculated Fields
  • Power Query Introduction
  • Importing Data
  • Defining data types 
  • Basic, Text, Numerical and Date Transformations 
  • Aggregating Data
  • Advanced Techniques

Course Outline

1. Day 1

  • a. History of Six Sigma
  • b. Learning the “belts” (White Belt – Master Black Belt)
  • c. How to Develop a Strategic Alignment & Deployment Plan (SA&D)
  • d. Principles of Lean
  • e. Types of Waste
  • f. Current State Process Mapping
  • g. Future State Mapping
  • h. How to develop an Action Plan

2. Exam

  • a. Once the student has completed the course they will have access to the exam for 14 days.
  • b. Students must make a 75% to pass, you will have 3 attempts to pass.
  • c. The Exam is a 15 question multiple choice exam.
  • d. Once the student passes the exam they will receive a digital LSS White Belt Certificate, which includes CEU Credits, and a digital LSS White Belt badge icon.

Course Outline:

1. Day 1

  • a. How to Develop a Strategic Alignment & Deployment Plan (SA&D)
  • b. Principles of Lean
  • c. Types of Waste d. SWOT analysis
  • e. Problem Statement & Charter Development
  • f. KPI Development
  • g. Process Walk/Spaghetti Chart

2. Day 2

  • a. How to determine Value added/Non-Value added
  • b. Root Cause Analysis
  • c. How to lead a 5S Event
  • d. Mistake Proofing
  • e. Future State Mapping
  • f. How to develop an Action Plan

3. Exam

  • a. Students will have access to the exam for 14 days, and will have unlimited number of attempts to pass (80% required to pass)
  • b. 25 Multiple Choice Question Exam
  • c. Upon passing the exam (80%) students will receive a digital Lean Six Sigma Yellow Belt Certificate (which includes 16 CEU Credits), and digital LSS Yellow Belt badge icon.

Course Outline:

1. Day 1

  • a. Principles of Lean
  • b. Types of Waste
  • c. Team Dynamics
  • d. Single Piece Flow/Push v. Pull/ Perfection

2. Day 2

  • a. SWOT analysis
  • b. SIPOC Charts
  • c. Process Walk/Spaghetti Chart
  • d. KPI Development
  • e. Pre-Event Data Gathering
  • f. Value Stream Mapping

3. Day 3

  • a. How to determine Value added/Non-Value added
  • b. Ideal State Mapping
  • c. Root Cause Analysis
  • d. How to lead a 5S Event
  • e. Standard Work & Visual Management
  • f. Mistake Proofing

4. Day 4

  • a. Takt Time
  • b. Future State Mapping
  • c. How to develop an Action Plan
  • d. How to Facilitate a Process Improvement Event
  • e. Post Event Activities

5. Exam and Certificate

  • a. Once the course is completed students will have access to the exam for 14 days. Students have 3 attempts to pass the exam (80% required to pass)
  • b. Exam is 60 multiple choice question
  • c. Once the exam is passed students will receive a digital Lean Six Sigma Green Belt Certificate (which includes 32 hours of CEU Credits), and a digital Lean Six Sigma Green Belt badge icon
  • Import Data
  • Data Modeling
  • Create relationships between multiple tables
  • Perform Calculations
  • Data Integration
  • Overview
  • Connect to data
  • Visualizations
  • Items
  • Variables
  • Snapshots and Stories

Empower Your Team

An organization’s biggest asset is its people.
Strengthen your team’s 
ability to manage, understand, and present your data with personalized, on-site, instructor-led classes through Dashboard University.

Get More Done.

Teksouth’s Dashboard University (DBU) provides DoD FM professionals–both civilian and service personnel–with the skills they need to get more done. DBU is a family of technical training courses specifically designed for the functional needs of FM specialists. The courses focus on extending the use of existing software tools to automate the error-prone, manual processes common within the DoD’s FM community.

More Training. Less Travelling. Best Value.

DBU training courses are conducted on-site at your
location over a 5-day period. Each course session
accommodates up to 20 attendees and delivers
up to 800 cumulative training hours at little or no
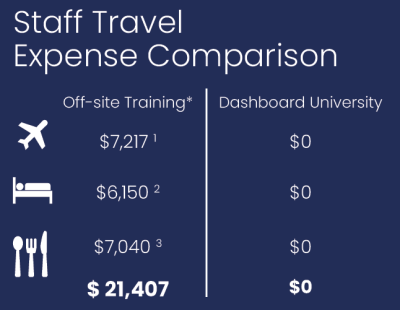
travel costs. Consider that the travel expense for
20 attending off-site training can easily exceed
$20,000. Spending less on training-related travel
means you retain more of your budget for actual
training.
Capture
¹ U.S. Bureau of Transportation, Q3 2017, avg. airfare between Houston and Chicago. ² Stata.com, October 2017 average hotel room ³ GSA mid-tier per diem allowance